
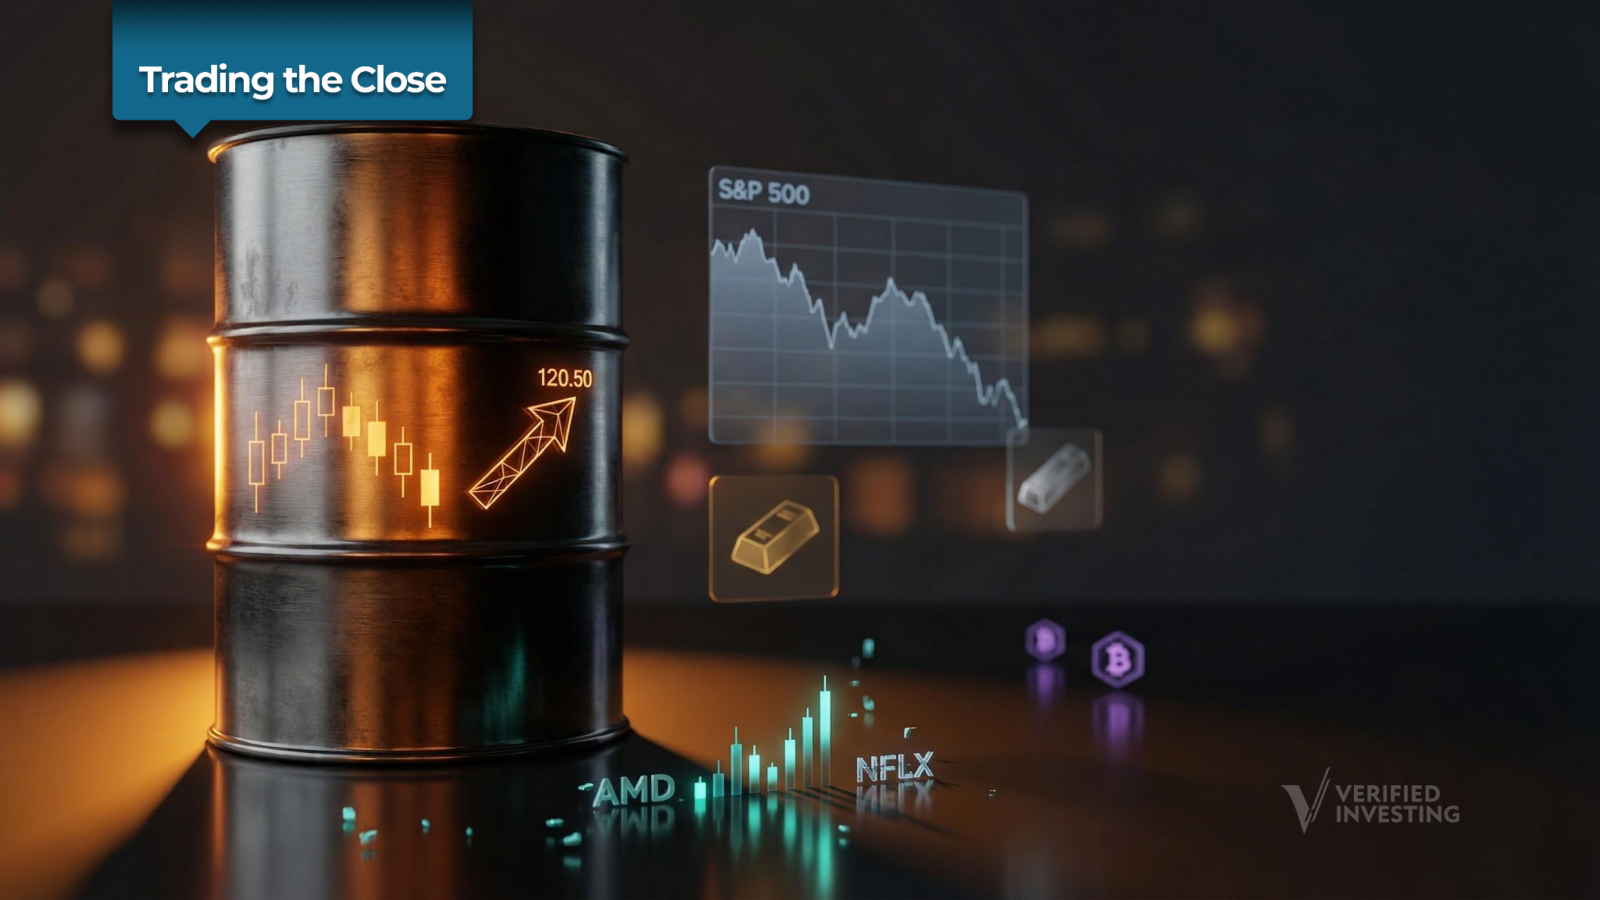
Oil Surge Amid Geopolitical Tensions; S&P Rally and Nvidia, AMD Moves Recap
Understanding the Volatility in Financial Markets
Today’s financial markets experienced a dramatic shift, characterized by sharp price movements influenced largely by geopolitical events. The U.S. president’s announcement that the conflict in Iran would extend for another two to three weeks caused a surge in U.S. oil futures and a drop in equity futures. However, the situation changed significantly mid-morning when reports emerged that Iran and Oman were working on a protocol to monitor traffic through the Strait of Hormuz.
In this afternoon’s Trading The Close Market, Pro Trader Drew Dosek from Verified Investing analyzed how the market interpreted these complex geopolitical developments. Despite the U.S. stating it has no intention of opening the Strait before exiting the conflict, investors saw an opportunity for a localized resolution. Yet, as experienced traders know, rallies driven by headlines often hide underlying technical weaknesses. This article explores the critical levels, volume discrepancies, and high-probability setups that emerged during today’s volatile session.
The Illusion of Strength: Why Volume Tells the Real Story
The S&P 500 showed a strong intraday recovery, moving from a low of 645 on the SPY ETF to close at 655—a 10-point move. On a 10-minute chart, the index was riding a declining trend line that seemed poised to offer only temporary support before further breakdown. When the 10:00 a.m. news hit, volatility shook the price action, leading to a bullish consolidation by the closing bell.
However, a deeper analysis of the market internals reveals a significant red flag: volume. The S&P 500 traded only 66.88 million shares. “That tells me there’s not a lot of conviction with this move,” noted Drew. In technical analysis, volume is a key indicator. While price can be manipulated by short-covering or algorithmic reactions, sustained, high-volume buying is needed to confirm true institutional participation. Historical data shows that low-volume rallies at the top of channels often act as bull traps. Drew pointed out that previous instances of similar volume levels at these heights almost always led to further downside.
“This suggests that smart money is using this bounce to distribute shares, not accumulate them,” he explained. With a three-day holiday weekend approaching, lighter volume is expected, but a headline-driven rally of this magnitude should theoretically bring institutional money off the sidelines. The fact that it didn’t indicates that the market may be preparing for a potential downturn.
Geopolitics and Energy: The Oil and Natural Gas Setup
The geopolitical situation in the Middle East has a direct impact on energy markets, which in turn affects the broader economy. US Oil has been trading within a highly technical hourly parallel channel that has contained recent headline-driven price swings. Following the overnight presidential announcement, oil surged toward the top end of this channel before facing rejection.
The intraday price action has formed a textbook inverse head and shoulders pattern on the 10-minute chart. This bullish reversal pattern, characterized by a left shoulder, a lower head, and a higher right shoulder, projects a measured move target of $117.11. If US Oil reaches this level, it implies that weekend complications could further restrict global supply availability. Rising energy costs typically put immense pressure on equity markets by squeezing corporate margins and consumer wallets. Traders must closely monitor this inverse head and shoulders pattern, as its resolution will likely dictate the broader market’s tone come Monday.
Meanwhile, Natural Gas continues to test the patience of traders. The commodity remains entirely range-bound, waiting for the $2.71 level to be hit. As this consolidation drags on, the probability increases for a deeper flush toward the $2.41 target. This perfectly illustrates a core tenet of professional trading: if a setup isn’t ready, you simply sit on your hands and wait for the price to come to your predefined levels.
Tech Giants and Broader Indices: A Mixed Technical Picture
The broader indices presented a mixed bag of technical signals today, reflecting the market’s underlying indecision. The NASDAQ managed a positive close, up 0.11%, but remains trapped within yesterday’s candle range. Earlier in the session, it threatened to break back underneath its parallel channel, but the close kept it in a state of consolidation just below current resistance at 24,117. This failure to confirm a breakdown, combined with the inability to break out, leaves tech investors in a precarious neutral zone heading into the long weekend.
In the small-cap space, the IWM (Russell 2000 ETF) delivered a promising close above $250.25. Small caps have been attempting to break out of a bearish consolidation phase, and today’s price action hints at the formation of a rounded bottom. However, as we saw on March 25th, a single daily close above resistance means nothing without follow-up momentum. Monday’s session will be critical to confirm if this rounded bottom has the structural integrity to hold.
The semiconductor sector, tracked by the SMH, staged a remarkable recovery from its morning lows, closing up 0.09%. While it ripped right back through an inclining trend line, it failed to test the bottom of its parallel channel at $396.94. A daily close above this $396.94 level next week would inject a heavy dose of near-term bullish sentiment into the chip sector.
The Breakout Retrace: A Masterclass in AMD and Netflix
One of the most reliable and profitable setups in swing trading is the “breakout retrace,” and Advanced Micro Devices (AMD) is currently providing a textbook example. “How many times have we talked about breakout retrace plays? They happen so often and they work so often too,” Drew emphasized. AMD had been trapped under a declining trend line, consolidating sideways in what appeared to be a bearish manner. When it finally broke out, it surged higher before pulling back to retest that exact same declining trend line—this time from above.
In technical analysis, former resistance frequently becomes new support due to the psychology of market participants. Traders who missed the initial breakout wait for the pullback to enter, while short sellers use the retest to cover their positions. Since tagging that newly established support line on Monday, AMD has rocketed up 12.6%. The stock now faces immediate pivot resistance at $221. Because there is very little historical price action just above this level, a daily close over $221 dramatically increases the probability of a swift march toward the next major resistance target at $236.88.
Netflix (NFLX) is painting a similarly compelling technical picture, closing up 3.25% today. The streaming giant is currently fighting its way out of the bottom half of an inclining parallel channel. It is re-attacking previous pivots near $100 and $100.26. However, the true test for Netflix lies just above at a major declining trend line sitting at $104.54. Because this trend line has been tested and respected multiple times, a high-volume breakout above $104.54 could trigger a massive momentum shift, opening the door for a run toward the $115 level.
Tesla’s Delivery Miss and Nvidia’s Market Gravity
Fundamental news often acts as the catalyst to drive stocks into pre-existing technical levels. Today, Tesla (TSLA) announced it missed its delivery targets by 2%, sending the stock tumbling 5.42%. While competitors like Rivian boasted about meeting targets, the scale of Tesla’s operations—delivering roughly 30 times the volume of Rivian—makes this a relatively minor fundamental miss. Yet, the technical damage is notable.
Tesla is now consolidating near a critical support level at $357.23. If this level fails, traders should look immediately to a declining trend line that perfectly aligns with a massive gap fill from September 2025 at $340.72. Gap fills are notorious magnets for price action, and when they align with trend line support, they create high-probability bounce zones. A successful defense of the $340.72 level could set up a lucrative long trade targeting the top of the parallel channel at $375.
On the other side of the tech spectrum sits Nvidia (NVDA), the undisputed heavyweight champion of the current market cycle. “It’s going to be the tale of the markets, guys. If Nvidia can break this trend line and get up above, the rest of the markets likely are going to be pushing higher,” Drew explained. Nvidia has formed a fascinating triple bottom support structure after plunging beneath a major trend line dating back to April. In technical analysis, when a stock breaks a significant trend line and catches support, its natural inclination is to bounce back up and retest the underside of the trend line it just lost.
Nvidia is currently facing a dense resistance zone starting at $180.54. If it can chew through this overhead supply, the target becomes the March 16th pivot at $188.88. Because of Nvidia’s massive market capitalization and psychological influence, its ability to conquer $180.54 will likely dictate whether the S&P 500 and NASDAQ can sustain their own upward trajectories next week.
Yields, Metals, and Crypto: The Flight to Safety Check
Intermarket analysis is crucial during times of geopolitical stress. The 10-year Treasury yield, a primary driver of equity valuations, currently sits at 4.305%. The chart shows the yield hovering just below a critical low pivot from March 25th. A confirmed daily close beneath this pivot would increase the probabilities of further downside in yields, which traditionally provides a tailwind for growth and technology stocks.
In the precious metals market, we are seeing a divergence that warrants attention. Gold experienced a choppy, sideways session, closing near yesterday’s lows but remaining within yesterday’s overall price range. “Where did it close? In this instance, it closed within yesterday’s price range, so it’s really not too much to report on gold other than we’re right here starting to make consolidation,” Drew noted. Silver, however, is showing relative weakness. It continues to be rejected by a declining trend line and failed to follow through on Tuesday’s bullish momentum. Silver is now at risk of breaking down to retest its inclining support trend line at $64.07. This bearish consolidation in silver, juxtaposed against gold’s neutral stance, suggests that industrial demand concerns might be outweighing pure safe-haven flows.
Finally, Bitcoin remains trapped in bearish consolidation, dropping 1.65% today. The premier cryptocurrency has failed to catch a sustained safe-haven bid during this geopolitical flare-up. Patient traders are waiting for a flush under the psychological $50,000 level before considering new long positions, adhering strictly to the discipline of buying at support rather than chasing in the middle of a range.
The Psychology of the Holiday Weekend
As we head into a three-day holiday weekend, the psychological burden on traders is immense. The market is already experiencing violent intraday swings based on single news headlines regarding the Strait of Hormuz. Holding aggressive directional exposure over a 72-hour period where markets are closed—but geopolitical actors are not—is a recipe for gap-risk disaster.
The light volume seen in today’s S&P 500 rally indicates that institutional players are acutely aware of this risk and have chosen to step aside. Retail traders would be wise to follow their lead. Capital preservation is just as important as capital appreciation, and sometimes the best trade is no trade at all.
A Milestone for the Verified Investing Community
In the midst of navigating these complex markets, the Verified Investing community hit a massive milestone today, crossing 100,000 subscribers on YouTube. This achievement is a testament to the power of pure, unadulterated technical analysis and probability-based trading.
To celebrate, the team is launching a brand new channel, Verified Investing Extra, which will feature several new shows dedicated to providing even deeper market insights, trade setups, and technical education. In a market environment dominated by emotion and algorithmic noise, having a logic-based, data-driven community is more important than ever.
As we digest today’s low-volume rally, the looming energy targets, and the critical tech levels on AMD, Tesla, and Nvidia, the roadmap for next week is set. Enjoy the holiday weekend, protect your mental capital, and prepare to execute your levels without emotion when the opening bell rings on Monday.